For a complete list of 20 Engineering Test conducted please refer to Documentation link.
Test 1- As seen in Figure 1, a single ZS-X11D Electronic Speed Controller was characterized across 10 PWM duty cycles. Voltage and current consumption was plotted for each duty cycle. The power consumption from 36 Volt 4.4Ah battery with our target 10% duty cycle was also calculated seen in Figure 2.

Figure 1
Test: ZS-X11D ESCs at 10% Duty Cycle from MCU. Voltage and Duty cycle measurements were taken on oscilloscope and current was found through a current clamp around a phase wire out of ESC into motor. One ESC was tested and the readings were recorded and plotted in Excel.
Results: The total current consumption of 2 ESCs: 3.18 Amps Total power consumption: 13.30 Watts/hour at 10% duty cycle.
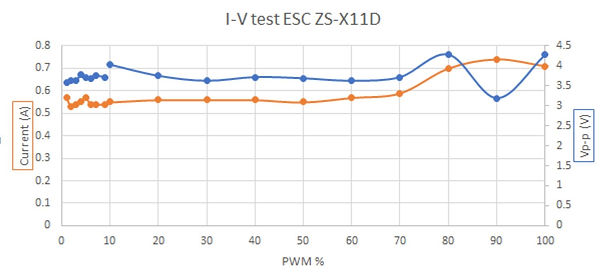
Figure 2
Conclusion: Our 4.4Ah battery has 1.22 Ah remaining with both ZS-X11D running at 10%. This current value for one hour is within our rover run time of less than 45 minutes.
Addresses: ER#1,2,6 and MR#1,2,3,4
Test 2- As seen in Figure 3, three spray can tips were depressed and their spray durations measured until empted. This averaged empty time will be used during spray can counter in our algorithm. As rover sprays line, a counter is decreatment to assess when it is time to change old can with a new full can in order to resume spray path.

Figure 3
Test: As seen in Figure 10, the spray can was left to spray until empty can. By pulling up and locking the sprayer cable to elevate spray tray, time-to-empty was found using a stopwatch app on cell phone. The times for the three paint cans were recorded and averaged to determine a spray can duration for the linear actuator work during relining. The power usage for the actuator will be based on this average time.
Results:

Conclusion: The average spray duration until empty was found to be 2:47 minutes or 167 seconds of continuous spraying. This average time will be used in spray time algorithm for linear actuator activation pulling on spray can tray cable to apply line on field. Each can contains 510 grams of paint stated on can label. The average rate of spray was found to be 3.054 grams/second.
Addresses: ER#5.1,5.2 and MR#5,10
Test 3- The force exerted by unloaded solenoids was measured with a spring scale in Figure 4.

Figure 4
Test: This test seen in Figure 12 is important because Bucky’s spray can actuator needs to apply a linear force greater than a loaded paint application system. Knowing the force needed to spray paint, our team can match a linear actuator to achieve current consumption efficiency of 1.2 Ah and effective displacement of spray cable of 3cm.
Results: 52 N-m were needed to overcome to loading effect of full can internal spring and spray can return spring. This force was recorded as the spray can proceeded with a maximum rate of paint application wide open.
Conclusion: A linear actuator needed to activate spray systems is required to apply a linear force to spray spring loaded can cable 3cm and internal can spring at a force greater than 52 N-m.
Addresses: ER#5.1 and MR#5
Test 4- As seen in Test 3, sum of loaded spring in system measured spray paint during operation is our target force. Three solenoids were tested to record their viability for displacing 3cm needed and force of 52 N-m in order to spray can autonomously.

Figure 5
Test: In Figure 5, three solenoids of different sizes and colors were clamped to edge of workbench. A spring scale was used to measure force applied by each solenoid receiving separate trials using a 12V benchtop power supply and transistor circuit also seen in Figure 6. A block of wood with ring was used to anchor the static end of spring scale at metal ring. While solenoids we activated, their linear displacement, Force exerted and current consumption were measured and recorded.

Figure 6
Results:

Conclusion: Based on the results seen from solenoids tested, more force is needed to spray can. These solenoids are ill suited for this spray task. Linear actuators with worm gear with travel for displacement driven by stepper motor is also a option for more testing and development.
Addresses: ER#5.1 and MR#1,5,10
Test 5- Odrive is a BLDC motor controller used to control the rover’s motion. The calibration and test setup of our BLDC motors is seen in Figure 7. Using Odrive’s calibration tool ‘Odrivetool’ running in Linux on Raspberry Pi3 to control motors allowed our team to test for vector control of motors. In this test, bidirectional control of each motor and low speed test were reported to ensure full rover maneuverability and a low rpm rate was used to complement the spray can rate as paint is being applied uniformly to grass from rover in motion.

Figure 7
Test: The goal of this test was to verify the Odrive controller ability to spin motors in both forward and reverse. Next, we tested the rate of spin of Motor1 with hall sensor feedback for position encoding. We tested for a constant velocity without motor cogging or bucking as this has been an issue with early motor controllers as seen in Field Test 3.1.
Results: Using the Odrive controller on Motor1 proved successful as we were able to verify that this motor can spin in both forward and reverse directions. Furthermore, our Hall Sensor detecting the rotor’s 28 pole pairs across 3 phase of BLDC motors (84 positions/rev) allowed calibration and and low speed control. A modification was recommended from the Odrive manufacture when using Hall sensor for position encoding. 22 nF capacitors were added between each Hall sensor input and ground. The capacitors added to circuit in order to help with noise suppression. This was found to be helpful when calibration errors were found from these low current sensors. The errors were for phase and resistance measurements during cal. RPM was determined by using set points in Figure 8. A stopwatch was used to time a single revolution. This value was divided by 60 to find RPM to be referenced for a desired rover speed while spraying.

Figure 8
Conclusion: The Odrive controller works well with BLDC Motor1. Our team aims to match a slow rate of wheel travel during spray can application. The dynamic rate of motors and the static rate of paint spray will yield uniform coverage per our customer requirement for clearly marked reapplied soccer lines. More testing is need while rover is in motion, spraying paint at 3 grams/second.
Addresses: ER#1.1,1.2 and MR#1,2
Test 6: Testing the Pixy2 camera and line/vector detection. In this test we used the Pixy2 in
order to detect a white line simulated using white strips of paper on a dark background. The
Pixy2 was connected to a microcontroller and computer to see the outputs while detecting the
simulated line. The setup is shown in Figure 9
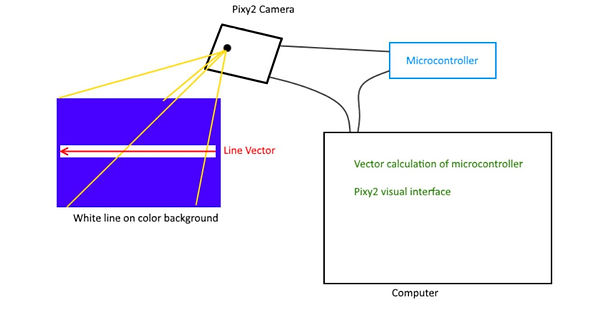
Figure 9
Results: We were able to detect the line consistently and gather usable data in order to guide the
rover along its path. The microcontroller receives usable data and vector positioning that makes
this possible.
Conclusion: Further testing is required, but the use of the Pixy2 and microcontroller is
promising and we are able to detect a basic line.
Addresses: ER#1.1,1.2,2.1 and MR#1.
Test 7: Right turn Test
Right Turn Calculation displacement of wheel was found during this test.
Measured radius of the wheel:
R=12 cm
Circumference = 2 pi R = 24 pi = 75.40 cm
1 Revolution = 16,000 counts per revolution
Figure 10 shows at which point the camera can no longer detect the white line. Rover should continue 40.5 cm past this point as this offset is important for next line alignment after right hand turn maneuver.
Converting cm to counts per revolution:
40.50/75.398*16000=8594.39 Counts per revolution.

Figure 10
Figure 10 shows that as Bucky passes 40.5 cm, the left wheel of Bucky does not move and the right wheel of Bucky moves clockwise 90 degrees.
The distance of the right wheel move ¼ *2* R*pi = 2/1 * 52.99 * pi = 79.10 cm
Convert cm to counts per revolution
79.10 cm = 79.10/75.40 *16,000 = 16,785.59 counts per revolution.
After the right wheel move clockwise 16,785.59 counts per revolution, the right turn is complete.